Strategy:
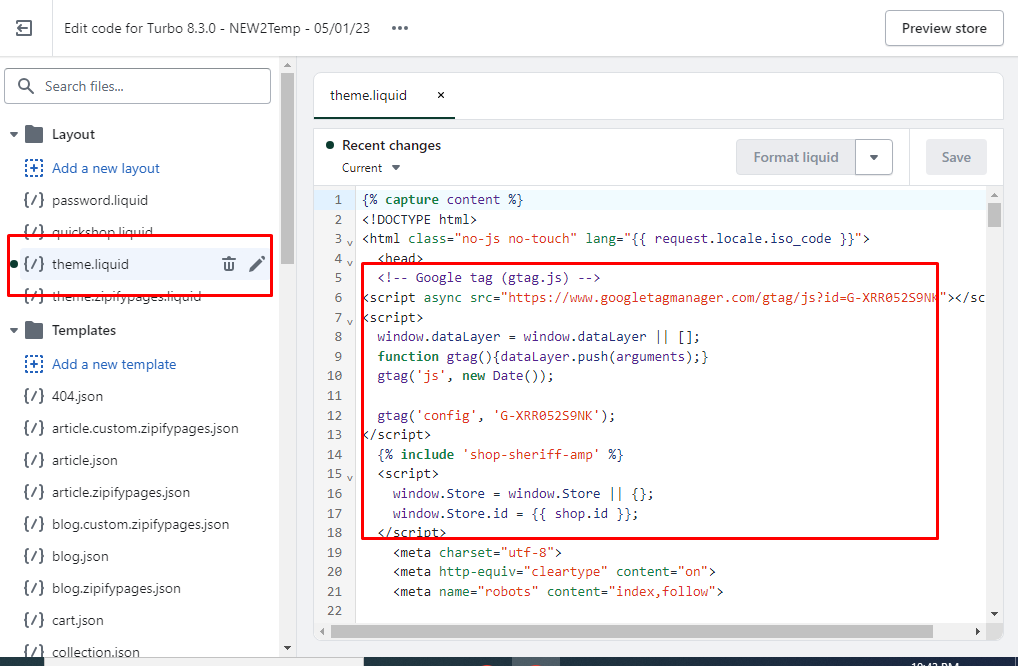
1. Google Analytics Setup: The first step was to ensure that Google Analytics was properly set up, with tracking codes in place to capture user data accurately.
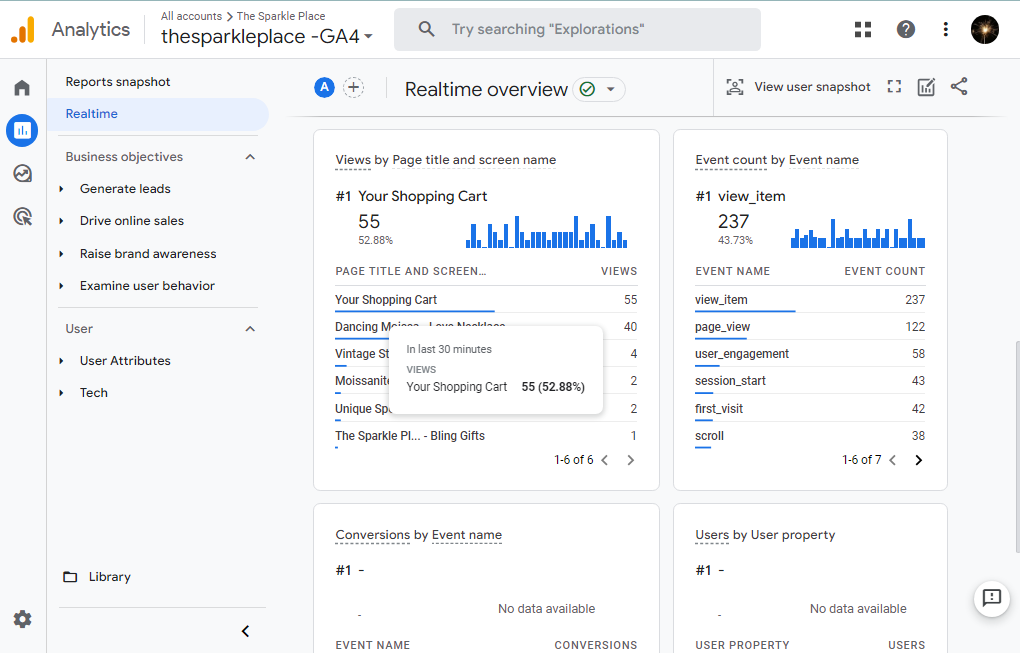
2. Event Tracking: Various events, such as clicks on product pages, add-to-cart actions, and completed purchases, were tracked to gain insight into user interactions.
3. Enhanced E-commerce Tracking: Google Analytics’ enhanced e-commerce tracking was implemented to track product performance, shopping behavior, and sales.
4. Goal Conversions: Goals were set up to monitor key actions like newsletter sign-ups and contact form submissions to gauge the success of non-sales-related activities.
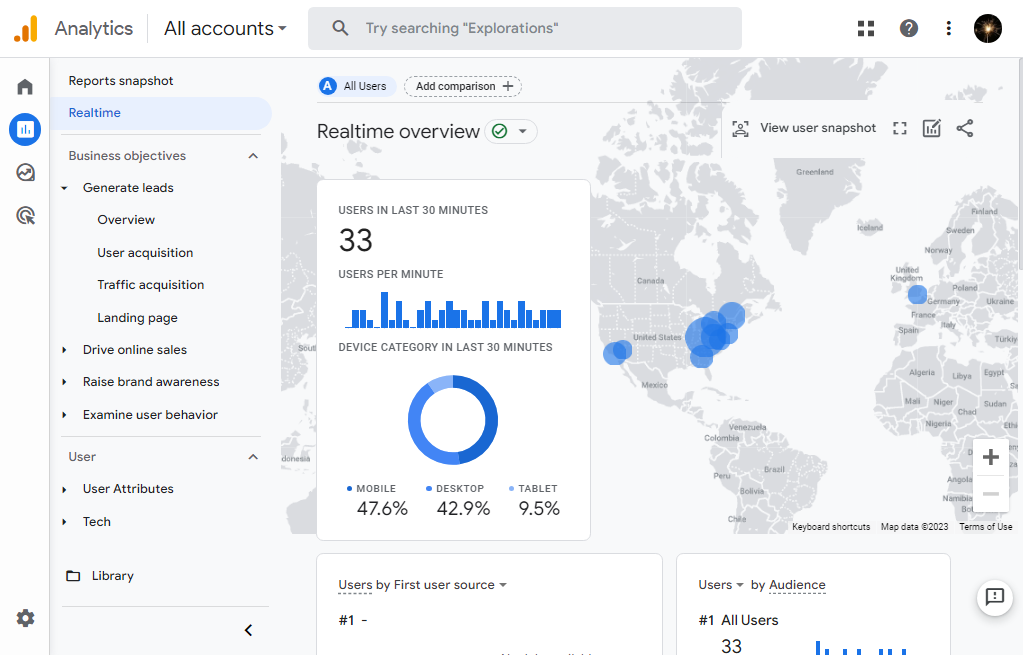
5. Funnel Analysis: Funnels were created to track user journeys and identify drop-off points in the conversion process.
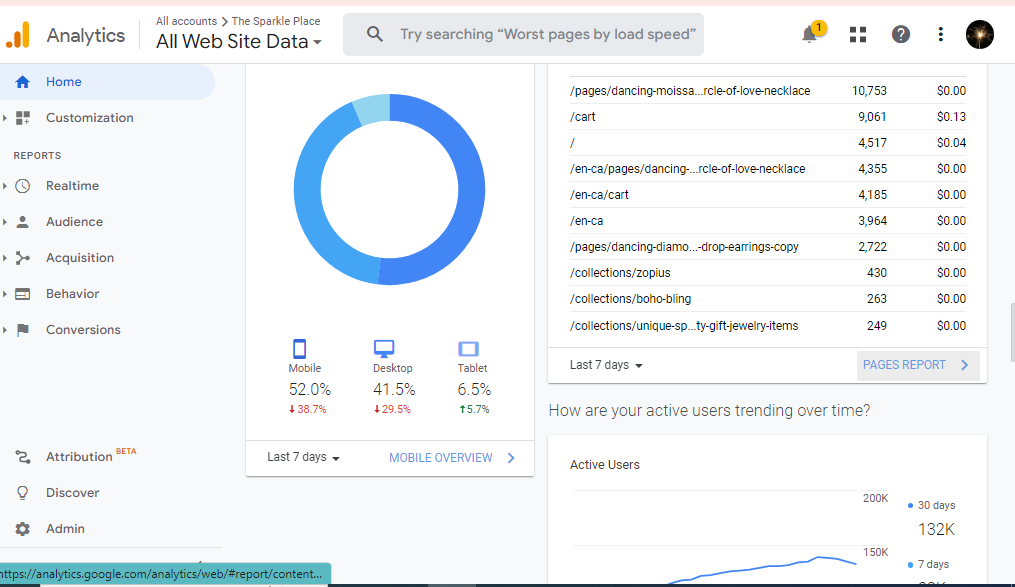
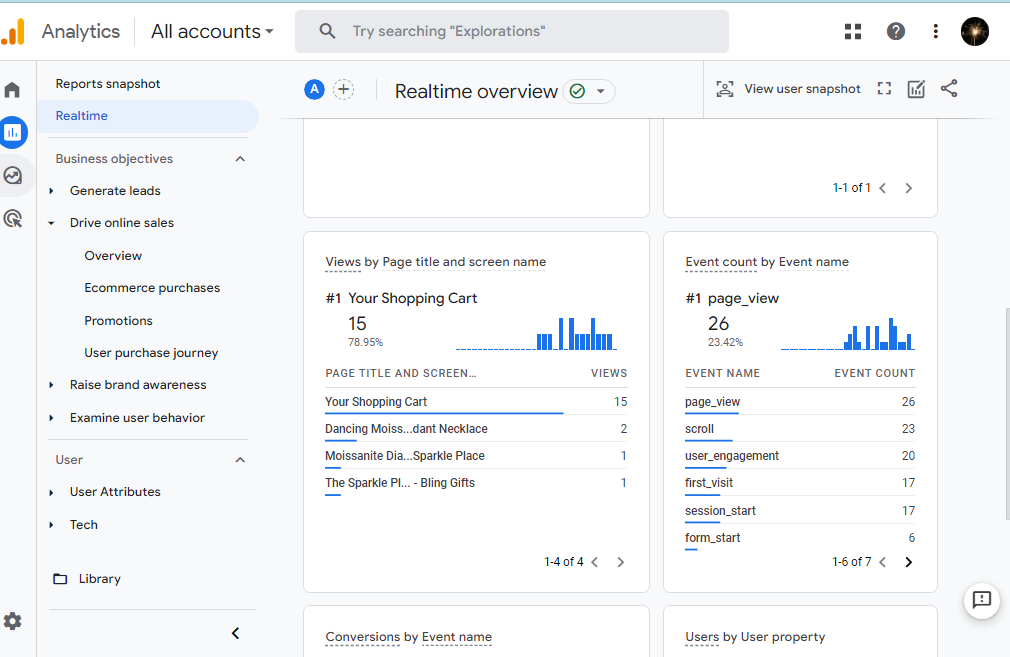
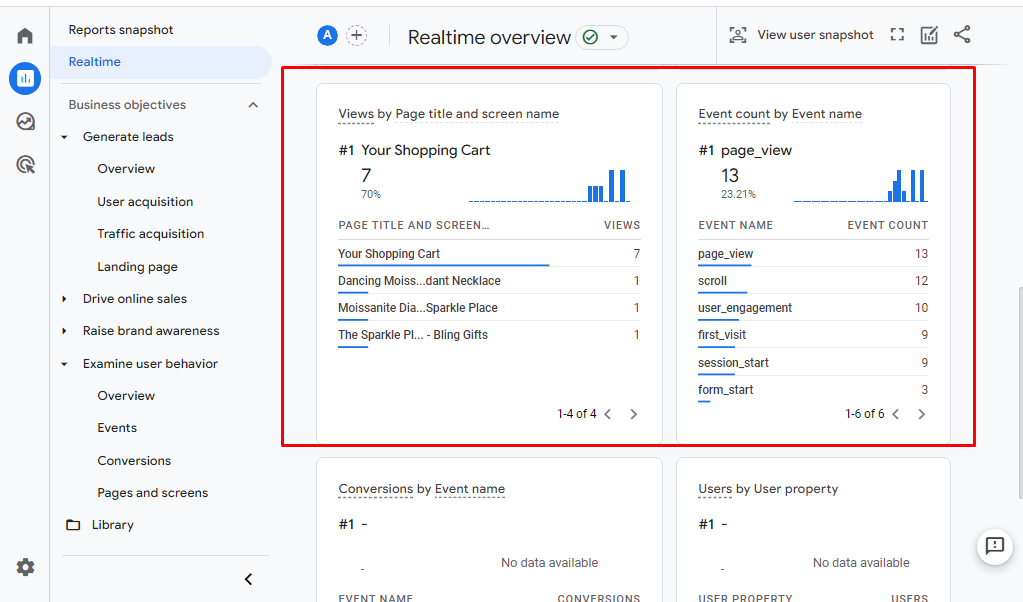
6. Custom Reports and Dashboards: Customized reports and dashboards were designed to showcase key metrics relevant to the E-commerce business, providing an at-a-glance view of performance.
7. User Behavior Analysis: Heatmaps, session recordings, and user flow analysis were used to understand how visitors were interacting with the website.
Results:
1. User Behavior Insights: Google Analytics provided a comprehensive view of how users navigated the website, which led to several key insights, including the discovery of a common drop-off point in the checkout process.
2. Conversion Rate Boost: By addressing the identified issues in the checkout process and refining the user experience, the website saw a 20% increase in conversion rates over six months.
3. Product Performance: Data from enhanced e-commerce tracking allowed [Client Name] to optimize product listings, promoting top-performing items more effectively.
4. Marketing Efficiency: With detailed data on user behavior, [Client Name] was able to refine their marketing efforts, focusing on the most effective channels and campaigns.
5. Improved User Experience: The website’s user experience enhancements led to a 15% reduction in bounce rates and a 25% increase in average session duration.
6. Custom Reports and Dashboards: Customized reports and dashboards provided [Client Name] with a streamlined view of their key performance metrics, making data-driven decision-making more efficient.